
Figure 6. Oncogenic KRAS regulates a BMP-7/BMPR1A signaling.
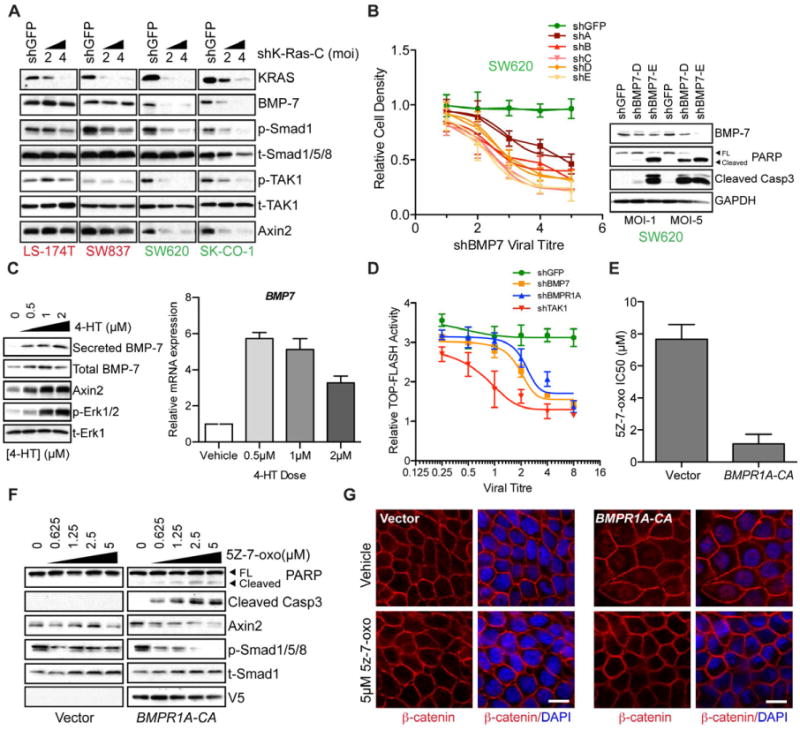
(A) Depletion of KRAS in two KRAS-independent (LS-174T and SW837) and two KRAS-dependent cell lines (SW620 and SK-CO-1) and subsequent effects on expression of BMP-7 as well as downstream effects on Smad1/TAK1 phosphorylation (p-Smad1/p-TAK1). The 20kD secreted form of BMP7 is shown. Phospho-TAK1 represents the TAK1 autophosphorylation site and is a measure of TAK1 activity. Total Smad1/5/8 and total TAK1 (t-Smad1/5/8/t-TAK1) proteins are shown as gel loading controls. Data are representative of two independent experiments.
(B) Effects of BMP7 depletion on proliferation and viability of SW620 KRAS-dependent cells. Plot shows cell density 6 days post-infection with either shGFP control or 5 different BMP7-directed lentiviral shRNAs. Data are represented as the mean of three independent experiments ± SEM. Western blots on the right panel show BMP-7 levels and apoptotic effects as measured by PARP and Caspase3 cleavage following BMP-7 depletion with two independent lentiviral shRNAs (D and E).
(C) Effects on BMP7 protein and transcript levels following induced activation of ER-KRAS(12V) fusion protein with various doses of 4-HT in HT29 cells. Left panel shows levels of total and secreted BMP-7 following ER-KRAS(12V) induction with 4-HT. Levels of Axin 2 and phosphorylated Erk (p-Erk1/2) are also shown following ER-KRAS(12V). Total Erk (t-Erk1) serves as a loading control.
(D) TOP-FLASH reporter activity following 4-HT induced activation of ER-KRAS(12V) and depletion of the indicated genes via lentiviral shRNA delivery at various viral titres. Reporter activity is shown relative to shGFP control.
(E) Introduction of a V5-tagged constitutively activated (CA) mutant of the BMP receptor, BMPR1A (Q233D) or control vector in HT29 cells and effects on 5Z-7-oxozeaenol sensitivity in terms of IC50 values.
(F) Signaling and apoptotic effects of TAK1 inhibition using 5Z-7-oxozeaenol at the indicated concentrations 24h post-treatment in BMPR1A-CA expressing cells. Caspase3 and PARP cleavage are indicators of apoptotic cell death. Axin 2 levels are shown as a readout of Wnt signaling. Phosphorylated smad1/5/8 levels serve as a readout of BMP signaling. GAPDH serves as a gel loading control. BMPR1A-CA expression is visualized using a monoclonal V5 antibody.
(G) Effects of BMPR1A-CA expression on β-catenin localization (red) in HT-29 cells following treatment with 5μM 5Z-7-oxozeaenol or vehicle control for 24h, as assessed by immunofluorescence confocal microscopy. DAPI-stained nuclei are shown in blue. Scale bar = 10μM.
See also Figure S5.