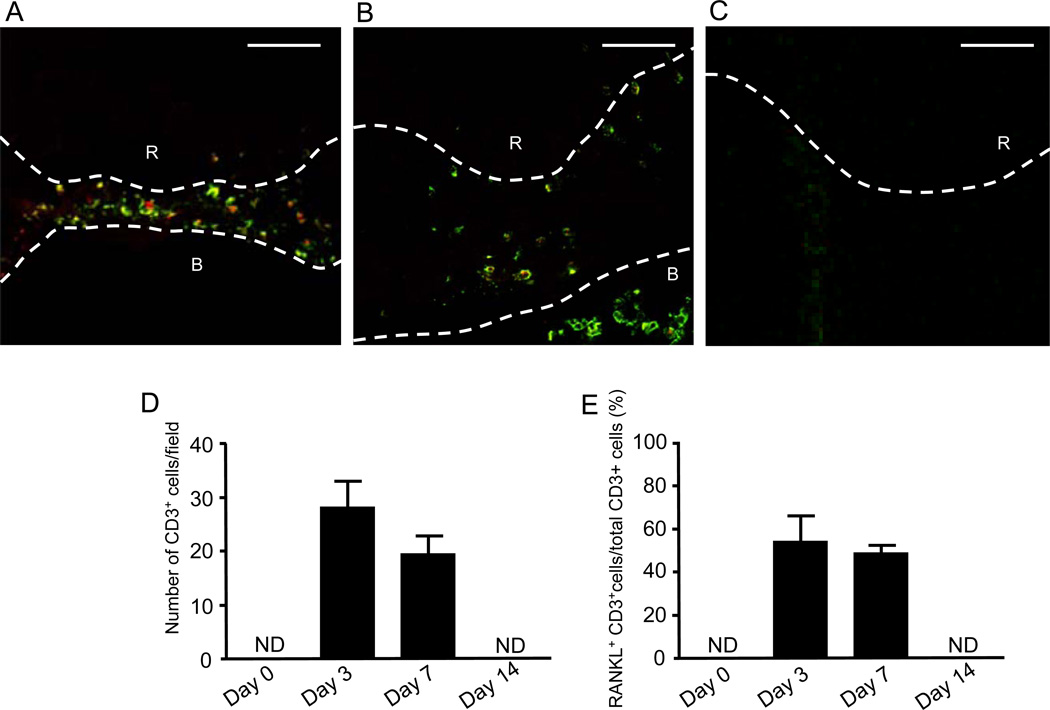
Figure 2.
Chronology of RANKL+/CD3+ T-cells localization pattern in periapical lesions in pulp exposure mouse model. (A–C) The periapical connective tissues at 3 (A), 7 (B) and 14 (C) days after pulp exposure was stained with anti-CD3 mouse antibody-FITC (green) for identification of T-cells and OPG-Fc-biotin/TexasRed-avidin (red) for RANKL. All fluorescent images were captured using a laser scanning confocal microscope. Root (R) and alveolar bone (B) are indicated by the upper case white letters. The white broken line demonstrates the border of root and alveolar bone. Scale bars: 50µm. (D and E) Quantitative assessment of total number of CD3+ T-cells (D) and percentage of RANKL+/CD3+ T-cells in the total CD3+ T-cells (E) are shown in the histograms. The column and bar indicate means ± SD; *, significantly higher than control non-pulp exposure group (day-0) by Student’s t-test (p < 0.05). NA: data not available.

