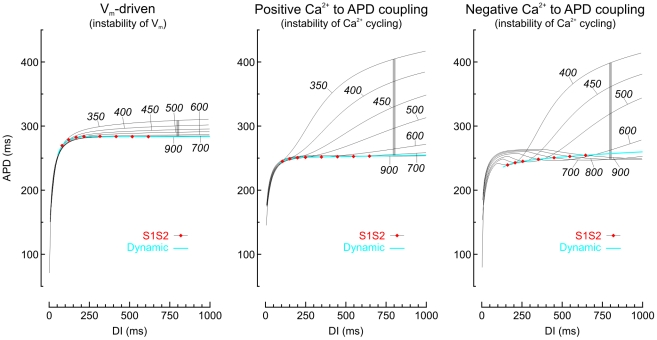
Figure 2. Dynamic and S1S2 restitution curves in the three model versions.
Each panel represents the dynamic restitution curve, i.e., steady-state APD vs. DI (blue) and several S1S2 restitution curves (labels indicate BCL, i.e., the S1S1 pacing cycle length). For each S1S2 restitution curve, a broad range of S1S2 intervals were explored, yielding DIs from 0 to 1000 ms. The intersections of the S1S2 restitution curves with the dynamic restitution curve are marked with red diamonds. The vertical gray bars denote memory amplitude at DI = 800 ms.

