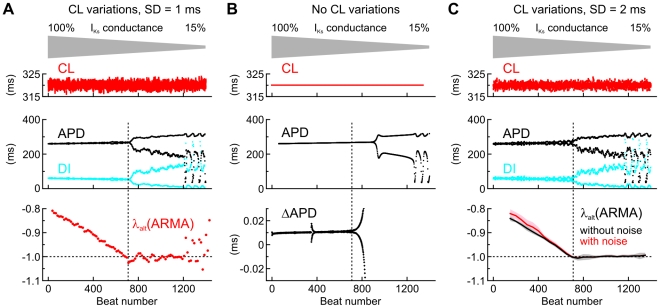
Figure 7. Predicting alternans in the Vm-driven model during a progressive decrease of IKs conductance.
A: CL, APD, DI and λalt during stochastic pacing (mean CL: 320 ms; SD of variations: 1 ms). λalt was estimated every 15 beats using a 2nd order ARMA model from APDs and CLs in a window spanning the 30 preceding cycles. B: CL, APD and the difference series of APD (ΔAPD) when pacing at a CL = 320 ms without variations. C: Top: CL, APD and DI during stochastic pacing (mean CL: 320 ms; SD of variations: 2 ms). Middle and bottom: Analysis of λalt in n = 10 simulations, with and without adding a Gaussian error (SD = 1 ms) to APD, simulating experimental measurement error. λalt was estimated every 75 beats using a 2nd order ARMA model from APDs and CLs in a window spanning the 150 preceding cycles. Data are presented as mean (bold lines) ± SD (shaded areas). In all panels, vertical dotted lines indicate the onset of macroscopic alternans (in A and C) and of micro-alternans (in B).

