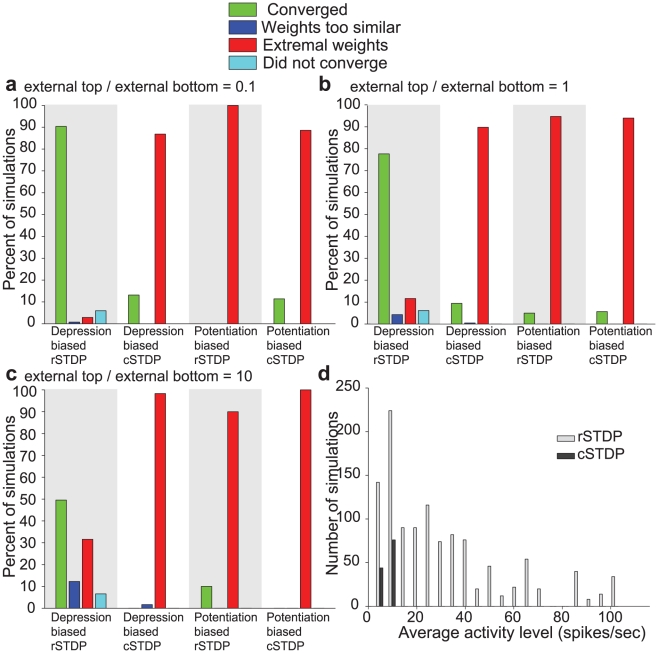
Figure 7. Summary of the results of the integrate-and-fire simulations with external input to bottom-layer and higher-layer neurons.
a–c. In the simulations described here, external input was conveyed both to lower-level neurons and to higher-level neurons. The ratio of the external input strength to higher-level neurons to lower-level neurons was 0.1 in a, 1 in b and 10 in part c. The format and other parameters are the same as in Figure 5 . d. For those simulations that converged (green in parts a–c), the histogram shows the distribution of average activity levels. The gray bars denote simulations using rSTDP and the dark bars denote simulations using cSTDP. Results from all three strength ratios (a–c) are combined in this plot. Those few simulations which are convergent under cSTDP have very low average firing rates.

