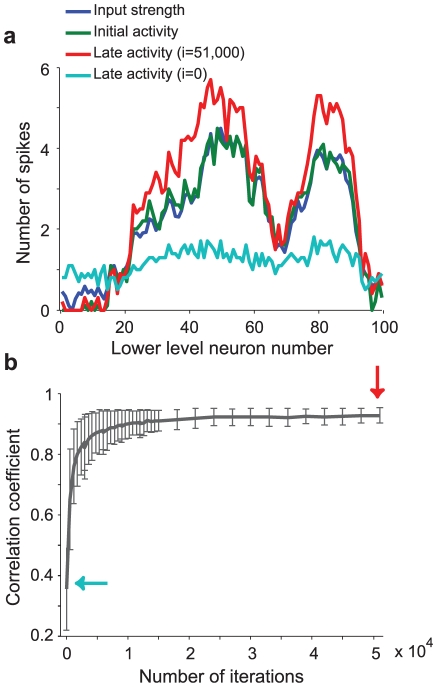
Figure 8. Integrate-and-fire network trained with rSTDP learns to reconstruct its input.
a. Example of the network's ability to reconstruct its inputs after training using depression-biased rSTDP. By construction, the strength of external input during a single stimulus presentation to each neuron in the lower layer (input strength, blue line) is similar to the average spike rate of each lower-level neuron during the initial period from 0–50 ms (initial activity, green line). The cyan and red lines show the average spike rate of each lower-level neuron during the later period (late activity, 80–160 ms), when activity is due to top-down stimulation, using the top-down weights given early in training (after 10 iterations, cyan line) or after 51,000 iterations (red line). b. Average correlation coefficient between early time and late-time neuronal activity rates as a function of the number of training iterations. The average is computed over n = 100 distinct external input stimuli, and the error bars represent the standard deviation of the correlation coefficients for the 100 stimuli. The arrows indicate the iteration numbers illustrated in part a.

