
Figure 1. Brain patterns of grey matter atrophy and 18FDG hypometabolism in a MCI.
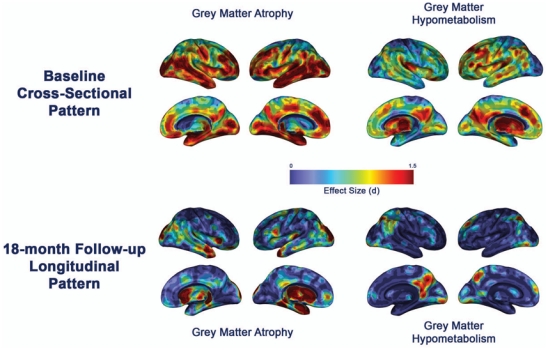
Profiles of brain alterations in patients with aMCI at baseline compared to healthy elderly (top) and over the 18-month follow-up (bottom). The effect size of each pattern is displayed on semi-inflated Anatomist 3D render (www.brainvisa.info; right and left hemispheres: lateral and medial views).