
Figure 2. Illustration of white matter alterations.
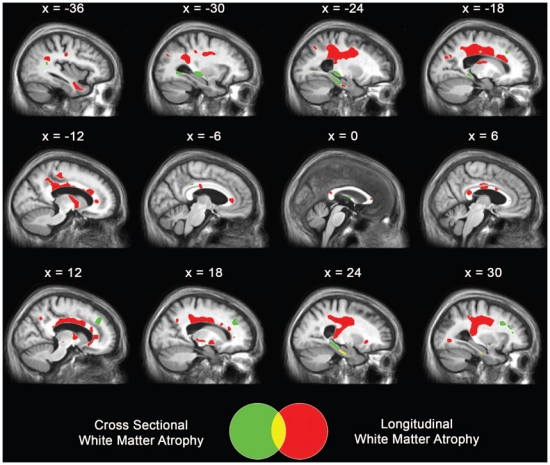
Areas of significant decrease in white matter regional volume in patients with aMCI at baseline compared to controls (green), and over the 18-month follow-up (red). Results are displayed at p < 0.001 uncorrected with k > 50 mm3 and projected onto sagittal sections of the mean aMCI MRI group template.