
Figure 6. Relationship between baseline uncinate fasciculus atrophy and 18FDG-PET percent change maps.
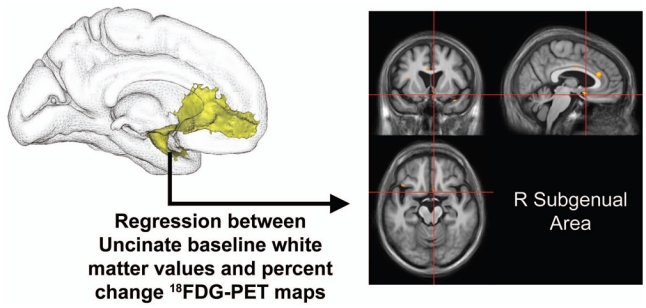
Results of the ROI-to-voxel regression analysis between baseline white matter volume in the uncinate fasciculus (highlighted in Figure 4) and 18FDG-PET percent change maps (thresholded at p < 0.005 uncorrected with k > 50 mm3). Left side of the brain is on the left.