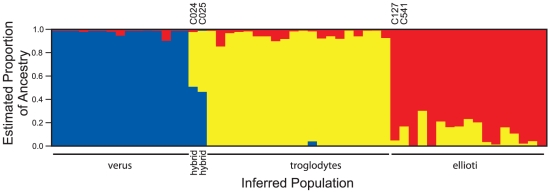
Figure 3. Structure estimates of ancestry in three populations.
For each sampled individual the figure shows the estimated proportion of ancestry from Structure's three putative ancestral populations, with P. t. troglodytes in yellow, P. t. ellioti in red and P. t. verus in blue. Structure reveals the same pattern of group memberships as PCA, and additionally suggests that P. t. troglodytes and P. t. ellioti individuals may share more DNA from the other group than either shares with P. t. verus (blue). The two known hybrid individuals (C024, C025, with ancestry estimated at close to 50% in each of P. t. troglodytes and P. t. verus) and two P. t. ellioti chimpanzees with P. t. troglodytes-like mtDNA (C127, C541) are labelled.

