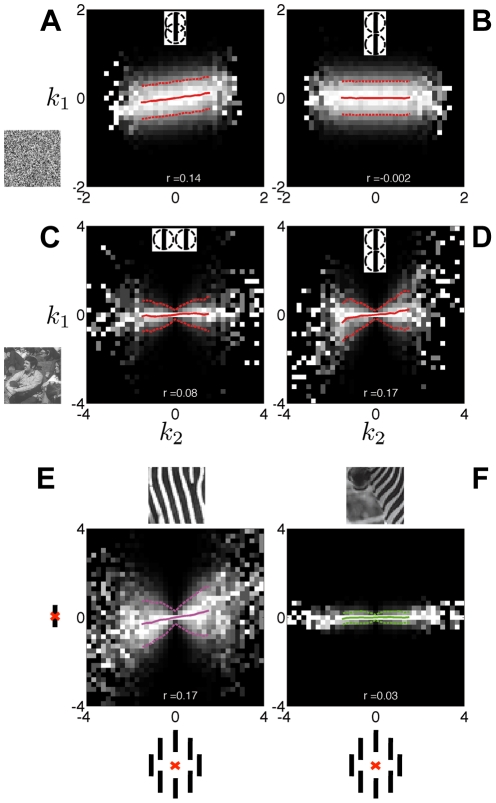
Figure 2. Dependencies amongst oriented filters vary with spatial layout, image set, and across image regions.
(A–D) Histograms of the outputs of one RF (k 1) given the outputs of the other RF (k 2). We computed these conditional histograms based on 100,000 Gaussian white noise image patches (A,B), or 100,000 natural image patches (C,D; the images are shown in Fig. S1). Pixel intensity is proportional to probability, larger values correspond to brighter pixels; we rescaled each column independently to fill the range of intensities. Solid and dashed lines denote the mean and standard deviation, respectively, of k 1 for each given value of k 2. We matched the average RMS contrast of noise and natural images; the larger range of RFs responses to natural images reflects the abundance of oriented features that are optimal for the RFs. The insets illustrate the orientation and relative position of the RFs: (A) collinear RFs with large overlap (3 pixels separation); (B,D) collinear, and (C) parallel but not collinear RFs, with minimal overlap (6 pixel separation). The bowtie shape in (C,D) shows that the variance of k 1 depends on the magnitude of k 2, which is typical of natural images. Further, we report the Pearson correlation coefficient between k 1 and k 2 at the bottom: the stronger linear dependence between collinear filters reflects the predominance of elongated edges and contours in scenes. (E,F) Histograms of the outputs of two spatially separated vertical RFs, at center (Y axis) and surround (X axis) locations, averaged across 8 surround locations as illustrated in the axis labels (black bars denote filters, the red cross denotes the center position; surround RFs are 6 pixels away from the center). In (E) we included only the subset of the patches in (C,D) that were best described by a model with statistically dependent center and vertical surround RFs; whereas in (F) we used the patches best described by a model that assumes independence between center and surround RFs (see Materials and Methods for model details). The variance dependence is weaker in (F) than (E).

