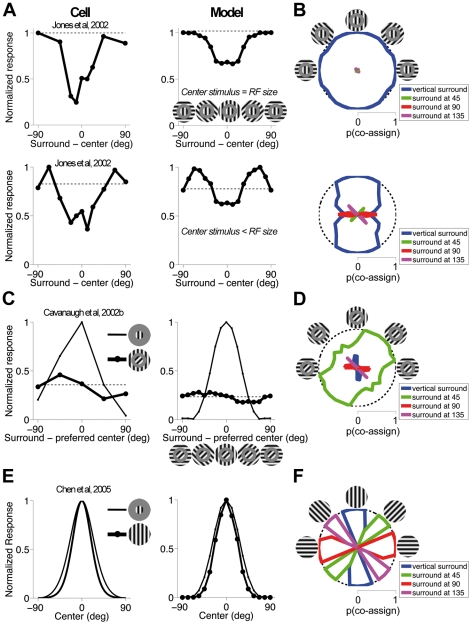
Figure 8. Orientation tuning of surround modulation.
(A) Normalized mean response rate of V1 neurons (top and bottom left; [10], their Fig. 1A and 4D, respectively) and the model (right) to mid contrast stimuli comprising an optimally oriented grating presented to the RF center, and an annular grating of variable orientation in the surround. The insets show some example stimuli. The outer diameter of the annular patches used to test the model covers the full extent of the surround, and the inner diameter (11 pixels) is larger than the center RF to ensure that the surround stimulus does not encroach on the center. In the top-right panel, the center stimulus equals the center RF diameter (9 pixels), in bottom-right panel it is smaller (5 pixels). Responses (circles) are plotted as a function of the difference between center and surround orientation. The dashed line denotes the response to an optimal grating patch not surrounded by an annulus. (B) Probability that center RFs and surround RFs of each orientation (colors indicated in the legend) are co-assigned to the same normalization pool; the stimuli are the same as in (A), and some examples are depicted in the icons. The bounding circle (dashed line) represents a probability of 1. Probabilities are plotted in polar coordinates: angular position represents the orientation of the surround stimulus; distance from the origin represents the probability. (C) Circles and thick lines: Normalized mean response rate of a V1 neuron (left; [9]) and the model (right) to stimuli similar to (A), except that the central grating is tilted 45 degrees away from the neuron's preference. Thin lines: Orientation tuning curves measured with a small grating. (D) Probability that center RFs and surround RFs of each orientation are co-assigned. The conventions are the same as in (B). (E) Orientation tuning curves of a V1 neuron (left; [11]) and the model (right) measured with small gratings confined to the center RF (thin line), and large gratings covering also the surround (thick line and circles): narrower tuning curves are observed with large stimuli. Each curve is normalized by the response to the optimal orientation. In the experiment, the diameter of large gratings is 5 times the center RF size; in our simulations, we used large gratings that cover the full surround extent. (F) Probability that center RFs and surround RFs of each orientation are co-assigned, for the large gratings. For each stimulus orientation, the surround group with orientation closest to the stimulus is co-assigned with center RFs.

