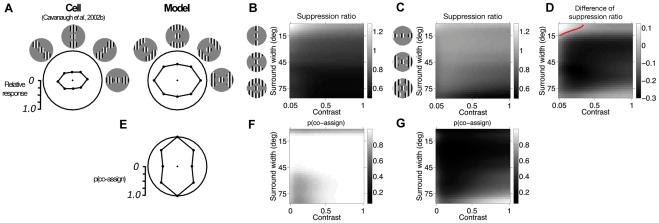
Figure 9. Spatial asymmetry of surround modulation.
(A) Normalized mean response rate of an example V1 neuron (left; [9]) and the model (right), to optimally oriented stimuli comprising a grating presented to the center of the RF, and peripheral patches confined to specific regions of the surround. Icons depict the stimulus configurations. The bounding circle represents the normalized response to the center stimulus alone. Responses are plotted in polar coordinates: angular position represents the location of the surround stimulus; distance from the origin represents the magnitude of response. In the experiments the size of the surround stimuli is optimized individually for each cell. For the model, we used annular sectors, rather than circular patches: first, this allowed us to explore systematically the changes in responses as a function of the surround stimulus angular size (thus making predictions beyond the original experiment); and, second, this was needed to recruit a sufficient number of surround RFs, given the coarse spatial sampling of the surround (Materials and Methods). (B,C) Suppression ratio (coded by pixel intensity) as a function of stimulus contrast and angular size of the peripheral patches (B collinear; C parallel). Suppression ratio is the ratio between the full-stimulus response and the response to the central grating alone; values greater than 1 denote facilitation, smaller than 1, suppression. (D) Difference of suppression ratios (coded by pixel intensity) between collinear and parallel configurations. Negative values imply that the collinear configuration is more suppressive than the orthogonal, and vice versa for positive values; the red contour denotes zero-crossing. (E) Probability that center and vertical surround RFs are co-assigned to the same normalization pool, and therefore contribute to the divisive normalization of the model response, for the stimuli of (A). (F,G) Co-assignment probability (coded by pixel intensity) as a function of stimulus contrast and angular size of the peripheral patches (F collinear; G parallel).

