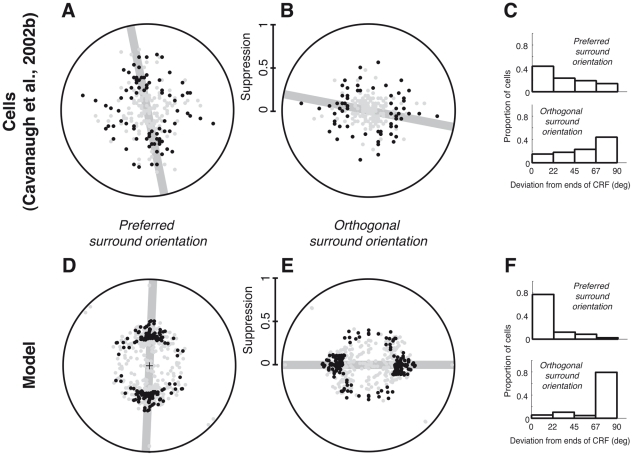
Figure 10. Variability of positional biases.
(A–C) V1 population data from [9], N = 113. (D–F) model simulations for 4 center orientations, 2 contrasts (0.25, 0.5) and 39 parameter sets resulting from different natural image training sets (see Materials and Methods). (A,D) were obtained with the surround stimuli of Fig. 9. The magnitude of the suppressive effect and surround location of greatest suppression are plotted in polar coordinates (duplicated around the circle for visualization): points farther from the origin correspond to stronger suppression than those closer to the origin. The location of maximal suppression is the angle of the vector computed from the response reduction, as in [9]. Black circles represent cases with a strong effect (i.e. the magnitude of the orientation bias estimate was at least 0.2 and the maximum suppression was at least 0.3; 42/113 cells in [9] and 83/272 instances of the model matched both criteria). The gray line shows the angle estimate for the cluster of such points. (B,E) were obtained with surround stimuli presented in the same locations as in Fig. 9, but oriented orthogonally to the center (see also Text S4). All conventions are the same as in (A,D). The effect was strong in 33/113 cells in [9], and 106/272 model instances. (C,F) represent, only for the cases with a strong effect, the distribution of the difference between the most suppressive surround location and the axis of preferred orientation.

