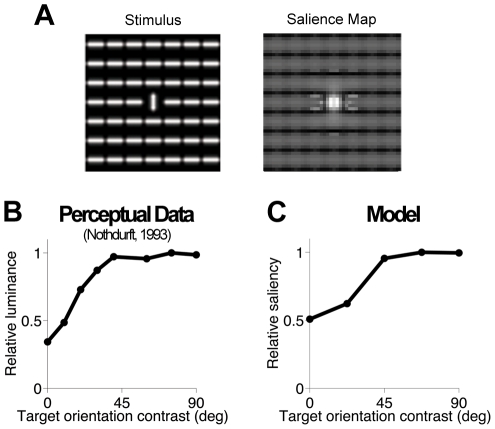
Figure 11. Perceptual pop-out in a population of model neurons.
(A) Example stimulus (left) and the corresponding salience map (right). Bars are 5 pixels long (i.e., smaller than RFs) and separated by 6 pixels (equal to RFs spacing; see Materials and Methods). Pixel intensity codes for salience, with brighter pixels denoting higher salience. (B) Mean perceived luminance [3] of a target defined by orientation-contrast, such as the vertical bar in the icon on (A, left). Perceived luminance is defined as the luminance of a luminance-contrast target (i.e. a bar with the same orientation as the background distractors, but higher luminance), required for it to be perceived as salient as the orientation-contrast target. Values are rescaled to a maximum of 1; the relative perceived luminance of the background bars is 0.36. (C) Saliency computed by the model for the orientation-contrast targets. Values are rescaled to a maximum of 1; the relative saliency of the background bars is 0.51.

