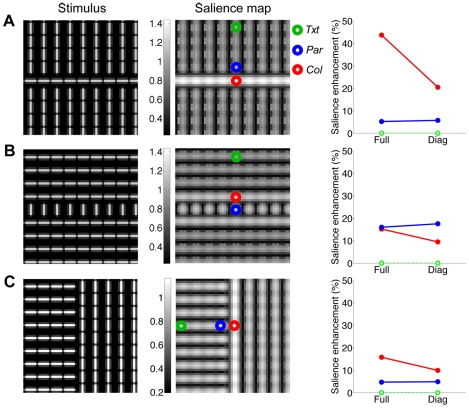
Figure 12. Perceptual saliency of collinear stimuli.
(A,B) Illustration of the collinear enhancement of salience. Left: Original stimulus. Bars are 5 pixels long and separated by 6 pixels (equal to RFs spacing; see Materials and Methods). Center: salience map (pixel intensity codes for salience, with brighter pixels denoting higher salience). Symbols on the map identify regions of homogeneous texture (Txt, green), and the boundary regions formed by collinear (Col, red) or parallel (Par, blue) bars. Right: salience enhancement (Y axis) is quantified as (Col-Txt)/Txt (red line and symbols, for the collinear side) and (Par-Txt)/Txt (blue line and symbols, for the parallel side); the enhancement is 0 by definition for the homogeneous texture regions (green line and symbols). On the X axis, Full stands for the results obtained with the full model, whereas Diag stands for a reduced model that sets the covariance between center and surround RFs proportional to the identity matrix, rather than learning it from scenes. (C) Illustration of the border effect. All conventions are the same as in (A,B).

