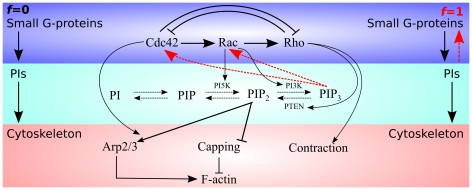
Figure 1. Signalling pathways assumed in the model.
The top row represents small GTPases, the middle row depicts phosphoinositides, and at the lowest level are the cytoskeletal components. Here we explore the effects of feedback from the PIs to the small GTPases, indicated by the red dashed lines. The parameter  in the model represents the magnitude of the feedback (
 means the feedback is absent,
  means it is essential for activating Cdc42 and Rac).

