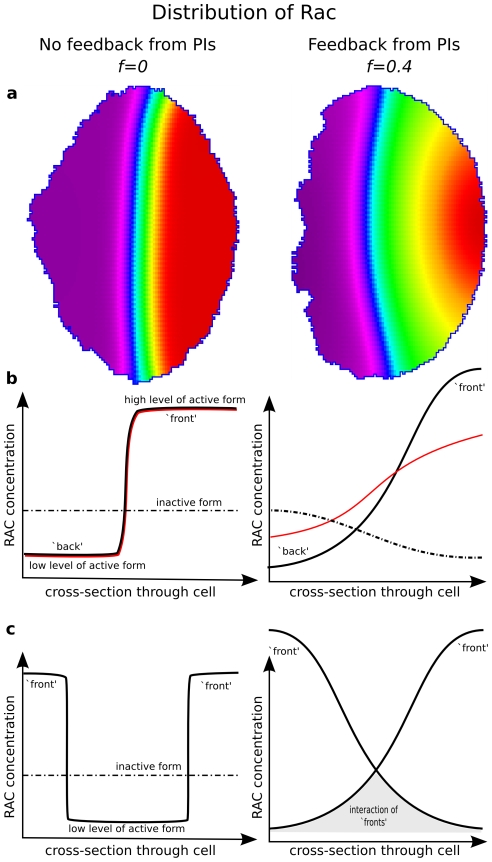
Figure 3. Schematics of how feedback from PIs change small GTPase profiles.
Shown are the Rac distributions in the 2D cell [(a) and Video S1] and in a representative 1D cross-section along the cell diameter (b,c). Left panels: absent PI feedback ( ). Right panels: with PI feedback (
 ). The sharp transition between high and low Rac activity is seen on the left (contours closely spaced), whereas PIs create a broader transition zone (right). Panels (b–c): schematics of differences in intracellular patterns due to maximal PI feedback to Rho proteins. (b): Inactive Rac (dot-dashed line) is nearly uniform for
  , but shows significant depletion close to the “front” for high
  . Decreasing the rate of diffusion
  of inactive Rac (red curves) has little effect on the profile when
  . In contrast, decreasing
  when
when  leads to a lower peak of active Rac at the front. Panels (c): Communication of multiple peaks of active Rac is very slow in the
  case, and much more significant in the case
  . Hence, feedback from PIs helps to resolve conflicting cell “fronts”.

