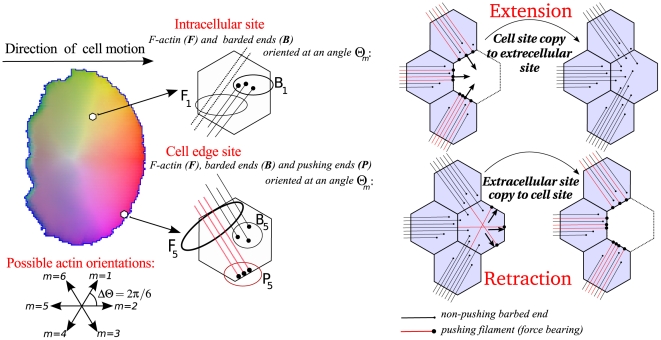
Figure 9. Membrane extensions and retractions.
(left) Filament and barbed end densities are described at each grid point within the simulated cell (schematically shown by two representative hexagons), and for all possible orientations  , shown at the bottom left. Additionally, close to the membrane we specifically distinguish between barbed ends that have not (yet) reached the membrane (
 ) and barbed ends that are effectively pushing against the membrane (
 ), thereby contributing to the forces required for cell extension. (right) The CPM allows for cell shape changes and movement through updates corresponding to small site extensions and retractions. Here, these updates take into account the density of pushing barbed ends. When the cell extends, the pushing barbed ends increase the likelihood of extension (top right – note that all red filaments end up with a pushing barbed end and therefore contribute to the forward motion), while during retraction the barbed ends offer resistence, reducing the likelihood of retraction (bottom right – also note that many black (non force-bearing) filaments are promoted to red (force-bearing) filaments when the retraction is accepted).

