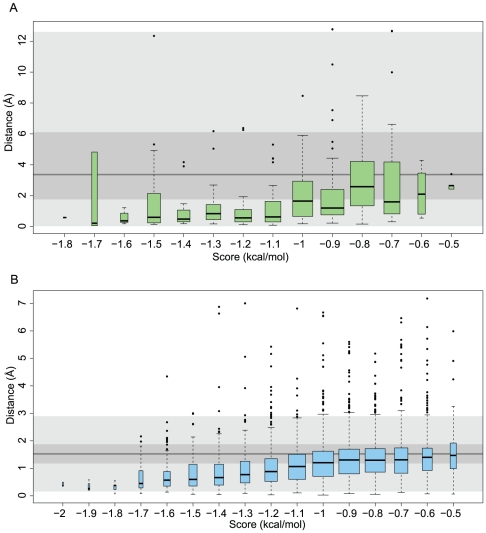
Figure 1. Box-plot summarizing the Vina score (in kcal/mol) versus the minimum distance (in Å) between the prediction and a crystallographic water (A) and MD water (B) from the data set in Table 1.
Each box's lower and upper limits are at the 25% and 75% confidence limits. The solid black line within each box indicates the median. The width of each box is proportional to the square root of the number of data points. Outliers are shown as black dots and are defined by points outside 1.5 times the interquartile range. For comparison, the results from a random placement of water molecules are shown by the grey background box (light grey represents the whiskers, darker grey represents the 25% and 75% confidence limits and the darkest grey line represents the median). The accuracy of the placement increases with a more negative score and all predicted sites with scores less than −0.5 kcal/mol are better than random.

