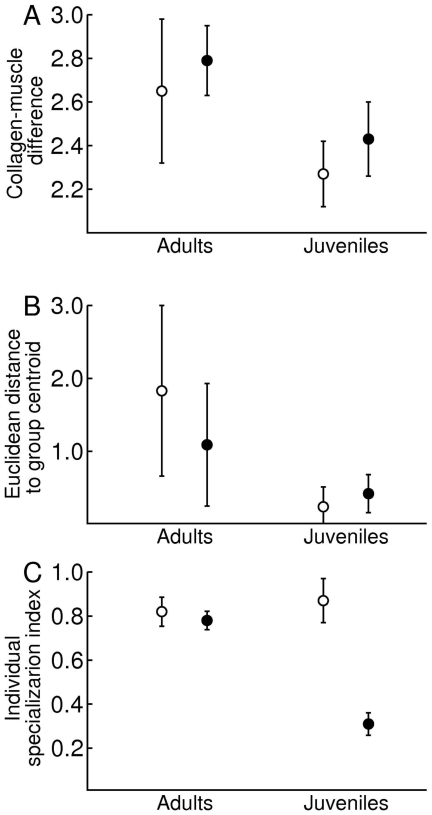
Figure 4. Individual isotope niche breadth (A), individual variation in individual isotope niche breadth (B) and the ratio of individual isotope niche breadth to population isotope niche breadth (C) of adult and juvenile foxes from coastal (open symbols) and inland (closed symbols) habitat on Iceland.
Individual isotope niche breadth was estimated as the Euclidean distance between collagen and muscle within individuals, between individual variation in individual isotope niche breadth was calculated as the Euclidean distance of each individual difference between muscle and collagen to group centroids in a 2 dimensional isotope space, and the individual specialization index relates individual niche breadth (WIC) to the total isotope niche breadth of each sample group (TNW). We calculated this proxy for WIC/TNW (following nomenclature of Roughgarden [1]) as the ratio of the average Euclidean distances of muscle and collagen samples to within individual centroids and the average Euclidean distances to group centroids. Groups were in all cases defined as age classes within each habitat. Figures presents mean ± 1 SE.

