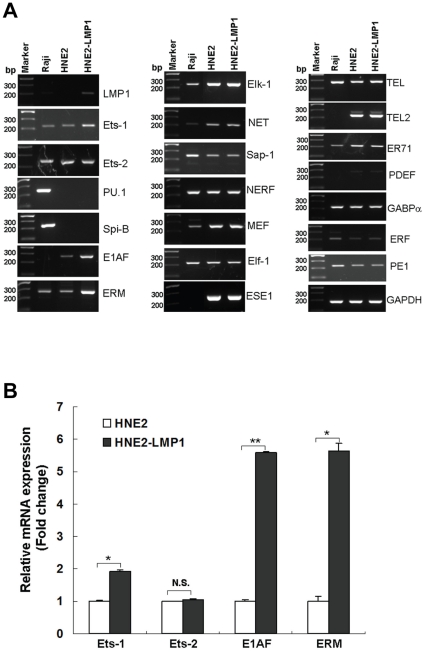
Figure 4. ETS family gene expression in human NPC cells.
(A)Total RNA was isolated from HNE2, HNE2-LMP1 and Raji cells and the expression of ETS family members at the mRNA level was analyzed by RT-PCR. The B-cell lineage Raji cell line was used as a control. GAPDH was used as an internal control. (B) mRNA expression levels for Ets-1, Ets-2, E1AF and ERM in HNE2 and HNE2-LMP1 cells were analyzed by quantitative real-time RT-PCR. The level of each mRNA from HNE2 was normalized to a value of 1. Fold-change in mRNA levels is shown. Values are presented as the mean ± S.D of two independent experiments performed in triplicate. Statistical significance: *p<0.01, **p<0.001.

