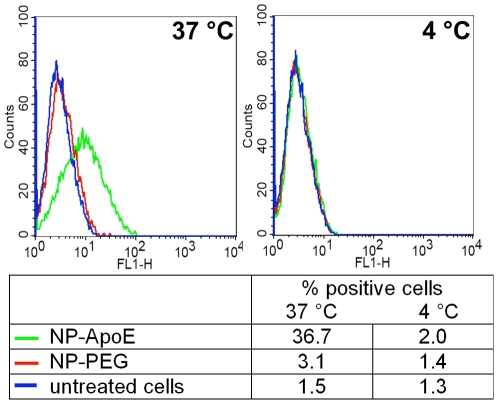
Figure 1. Specific cellular binding of the ApoE-modified nanoparticles studied by flow cytometry.
bEnd3 cells were incubated with ApoE-modified nanoparticles (NP-ApoE) or control nanoparticles without ApoE modification (NP-PEG) for 4 h at 37°C and 4°C, respectively. Flow cytometry analysis was performed to quantify their cellular binding. The data are shown as histograms of the FL1-H-channel (autofluorescence of the nanoparticles) as well as in the table with the analysis of the Y mean fluorescence and the percentage of positive cells. Green: NP-ApoE, red: NP-PEG, blue: untreated control.

