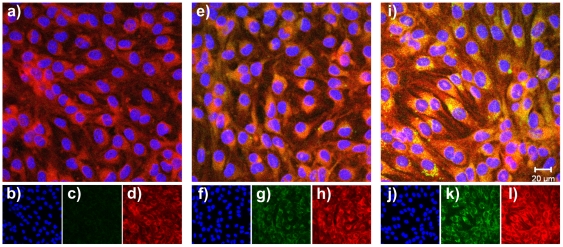
Figure 2. Cellular uptake and intracellular distribution of the nanoparticles studied by CLSM: split of the fluorescence channels. bEnd3 cells were incubated for 4 h with 0.1 mg/ml of the different nanoparticulate formulations at 37°C.
The green autofluorescence of the nanoparticles was used for detection. The cytosol was stained in red with CellTracker™ Red CMTPX, and the nucleus was stained in blue with DAPI. Pictures were taken within inner sections of the cells. Untreated control cells: a) overlay of all fluorescence channels, b) display of the blue nucleus channel, c) display of the green nanoparticle channel, d) display of the red cytosol channel. Cells with the unspecific control NP-PEG: e) overlay of all fluorescence channels, f) display of the blue nucleus channel, g) display of the green nanoparticle channel, h) display of the red cytosol channel. Cells with the specific NP-ApoE: i) overlay of all fluorescence channels, j) display of the blue nucleus channel, k) display of the green nanoparticle channel, l) display of the red cytosol channel.

