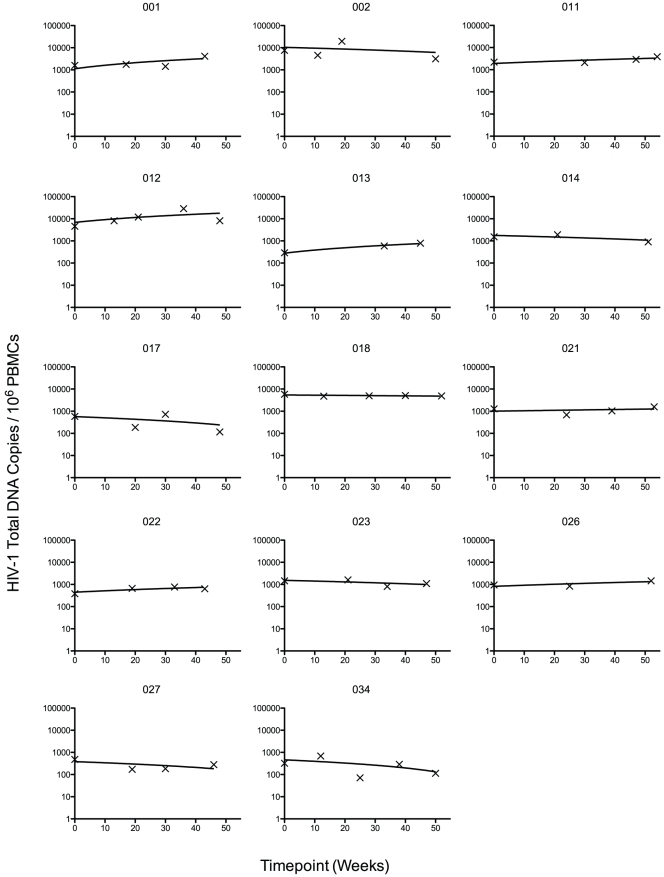
Figure 1. Plot of HIV-1 total DNA results for individual patients.
Plots of the 14 study patients: Each plot depicts an individual patient's levels total HIV-1 DNA levels in PBMCs (black ‘X’es) from baseline (week 0) to study endpoint. Solid lines are linear trendlines and may appear curved due to the log scale of Y-axis. The linear trendline demonstrates if the level of HIV-1 total DNA increased or decreased in each patient after the switch to a raltegravir-containing regimen.

