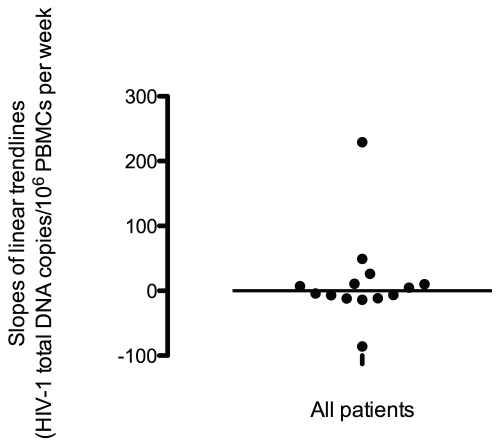
Figure 2. Slopes of HIV-1 total DNA trendlines for all patients.
The slopes of the linear trendlines for the study cohort are shown here. The horizontal solid line indicates the median trendline slope. A nonparametric one-sample Wilcoxon Sign Rank test of the slopes demonstrated no significant difference from 0 (p = 0.808), indicating no change in the total DNA levels of the cohort over the study duration.

