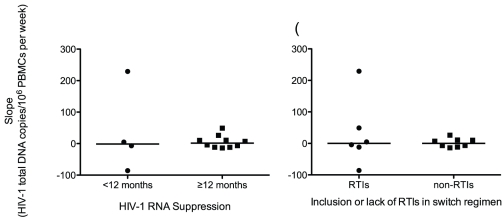
Figure 3. Slopes of HIV-1 total DNA trendlines grouped by A) duration of virologic suppression prior to switch, and B) RTIs in switch regimen.
Panel A) The study cohort was grouped into <12 months (n = 4) and ≥12 months (n = 10) of virologic suppression prior to the switch to a raltegravir-containing regimen. Analysis of the slopes of trendlines showed no significant difference from 0 in either group (p = 1.00 in <12 months and p = 0.770 for ≥12 months), indicating no effect of length of suppression prior to switching on the attenuation of total HIV-1 DNA levels. Panel B) The study cohort was grouped by the inclusion (n = 6) or lack of (n = 8) RTIs in the switch regimen. Analysis of the slopes of trendlines showed no significant difference from 0 in either group (p = 0.844 in both groups), indicating no measurable effect of the inclusion or lack of RTIs in our study cohort.

