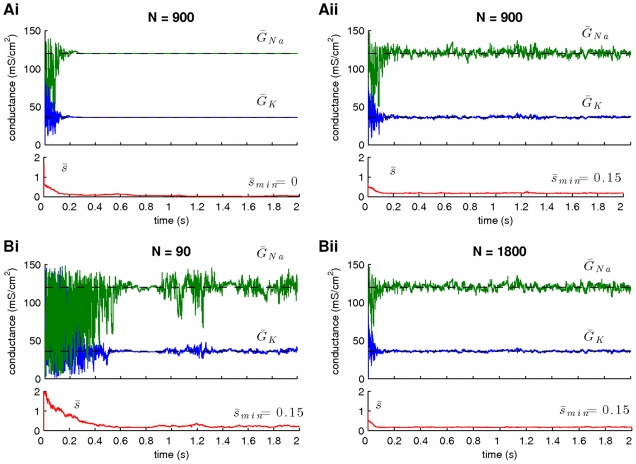
Figure 3. The effect of the size of the scaling factor .
 and the number of particles
 on the variance of the estimates. Large minimal values of
  and small values of
  imply large variance of the estimates. (A) Resampling of particles (see Methods) implies adaptation of (among others) the scaling factors
  , which gradually approach the lower bound of their prior interval (red lines in Ai,ii). A prior interval with zero lower bound (i.e.
  ) leads to estimates with negligible variance (Ai). A prior interval with relatively large lower bound (e.g.
  ) leads to estimates with non-zero variance (Aii). Notice that the expectation
  in Ai does not actually take the value
  (instead it becomes approximately equal to
  ). (B) A small number of particles (Bi,
  ) implies estimates with large variance (compare to Bii,
  ). Notice that the difference between Aii (
 ) and Bii (
 ) is negligible, implying the presence of a ceiling effect, when the number of particles becomes very large. In these simulations,
  and
and  .
.

