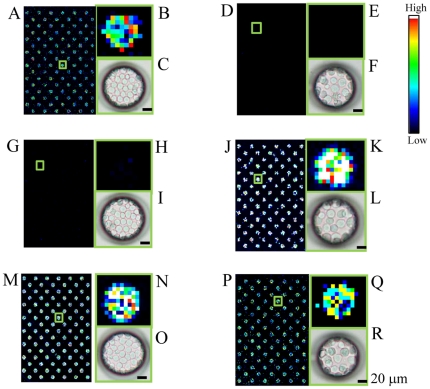
Figure 6. Fluorescence detection of T lymphoblastoid leukemia and carcinoma cells in the microchambers.
(A,D) Scanning images of T lymphoblastoid leukemia (A) and carcinoma cells (D) stained with APC-labeled anti-CD 45 monoclonal antibodies in 128 microchambers. (B, E) Magnified views of the boxed regions in “A” and “D,” respectively. (C, F) Light microscopic images of microchambers in “B” and “E,” respectively, showing tight confinement of the cells as a monolayer. (G, J) Scanning images of leukocytes (G) and carcinoma cells (J) stained with PE-labeled anti-cytokeratin monoclonal antibodies in 128 microchambers. (H, K) Magnified views of the boxed regions in “G” and “J.” (I, L) Light microscopic images of microchambers in “H,” “K,” respectively, showing cells tightly confined as a monolayer. (M, P) Scanning images of leukocytes (M) and carcinoma cells (P) stained with DiD in 128 microchambers. (N, Q) Magnified views of the boxed regions in “M” and “P,” respectively. (O, R) Light microscopic views of microchambers in “N” and “Q,” respectively, showing tight confinement of cells as a monolayer. (Bar: 20 µm). Color scale at the right represents the intensity of fluorescent emission.

