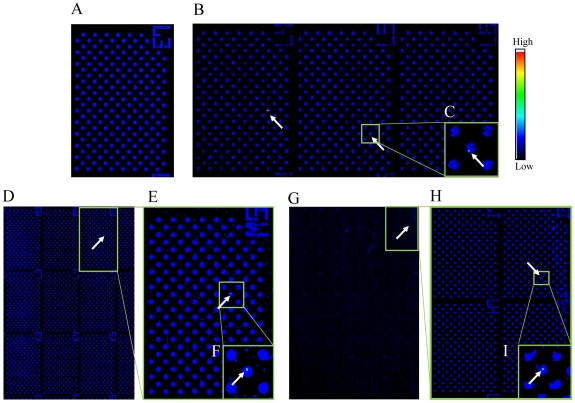
Figure 7. Detection of carcinoma cells among cultured T lymphoblastoid leukemia on a cell microarray chip.
(A–I) Scanned images of leukocytes/carcinoma cells on a cell microarray chip obtained with the microarray scanner. (A) Negative control (no carcinoma cells). (B, D, G) Carcinoma cells (0.01, 0.001, and 0.0001%) were scanned in 3, 9, and 64 clusters, respectively, on the cell microarray chip. (C, E, F, H, I) Magnified views of the boxed regions. Color scale represents the intensity of fluorescent emission.

