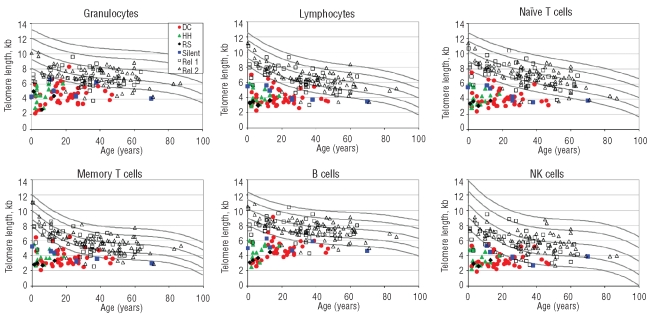
Figure 1.
Telomere length according to age in patients with DC and their relatives. The vertical axis represents telomere length in kb. The curved lines in the figures indicate the 1st, 10th, 50th, 90th, and 99th percentiles of results from 400 normal controls. Colored symbols represent patients with DC and their relatives. Red circles: classical DC patients; green triangles: Hoyeraal-Hreidarsson; black diamonds: revesz syndrome; blue squares: silent carriers; open black squares: DC relatives in families with unknown genes; open black triangles: DC relatives without mutations in the probands’ genes. Top panels show granulocytes, lymphocytes, and CD45RA-positive/CD20-negative naïve T cells. Bottom panels show CD45RA-negative memory T cells, CD20-positive B cells, and total NK/NKT cells.

