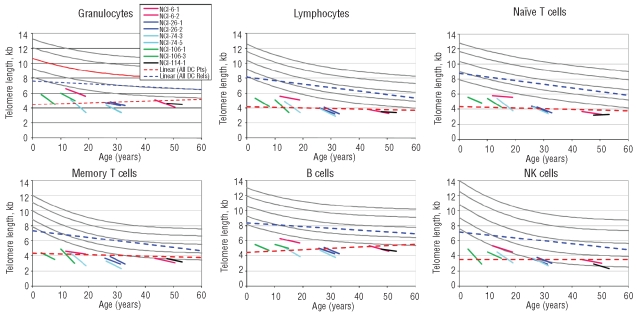
Figure 3.
Regression lines for telomere length according to age. The short lines indicate the change in telomere lengths in 9 DC patients over 5-year intervals. Red: NCI-6-1 and NCI-6-2 are mother and son with a mutation in TERC; Blue: NCI-26-1 and NCI-26-2 are identical twins with a mutation in TERT; Teal blue: NCI-74-3 and NCI-74-5 are brothers with a mutation in TINF2; Green: NCI-106-1 and NCI-106-3 are brothers with a mutation in DKC1; Black: NCI-114-1 with a mutation in TERC. The slope of the cross-sectional data for telomere length vs. age for the DC patients (_ _ _) is not significantly different from 0 in any lineage. In contrast, the slope for the cross-sectional results in DC relatives (_ _ _) is significantly negative (P<0.001) in all lineages.

