Fig. 1.
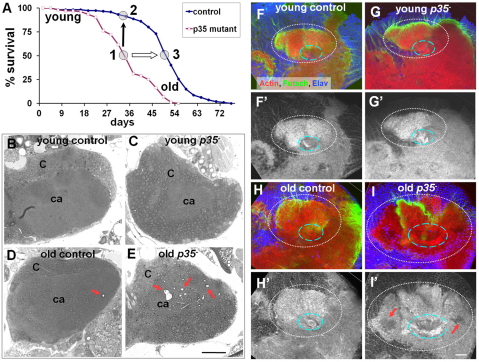
Neurodegeneration in p35null central brain. (A) Absolute chronological and relative physiological aging process. To account for their shortened lifespan, p35 mutants (p35−; point 1) were compared with age-matched wild-type control w− flies (point 2; black arrow for chronologically matched points) and also with control flies that had reached a similar position on their mortality curve (point 3; white arrow for physiologically matched points). (B,C) Young control and p35 mutant brains develop normally: C, cortex, Kenyon cells somatic region; ca, neuropil/calyx. (D,E) Vacuoles appeared randomly in old control brains but were accumulated in the MB area in old p35 mutants (red arrows). Vacuoles were present both in somatic and neuropil domains. Five brains for each genotype obtained in two independent experiments were sequentially sectioned. Thick (1 μm) plastic sections were stained with Toluidine Blue. Scale bar: 20 μm. (F–I) Actin cytoskeleton was deformed or deteriorated (red arrows) in old p35− brains. Identical regions in the MB at the level covering Kenyon cell bodies, calyx (white dashed line), primary neurites and beginning of peduncle (blue dashed line) are shown in merged confocal images of whole-mount brain preparation. Optic slice: 1.6 μm. Scale bar: 20 μm.

