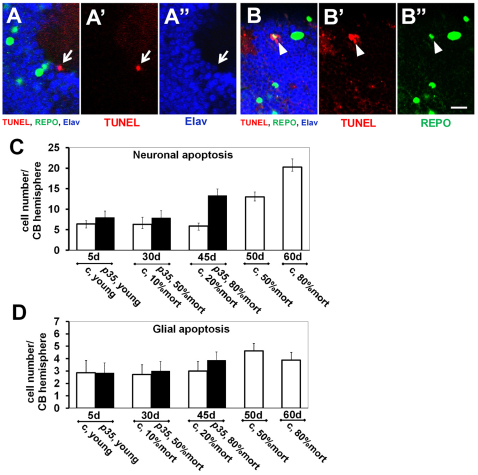
Fig. 2.
Age-dependent progression of apoptotic cell death. Representative examples show TUNEL-positive nuclei in neurons (Elav positive; A–A″) and glia (Repo positive; B–B″) in p35 mutant brains. Note the weaker Elav signal in the apoptotic neuron in comparison with surrounding cells (white arrow in A–A″) and the weaker Repo signal in dying glial cell (white arrowhead in B–B″). Single confocal plan, optic slice: 1.6 μm. Scale bar: 10 μm. (C,D) The absolute number of TUNEL-positive cells per hemisphere is presented on the y axis (n≥6; mean ± s.e.m.). (C) Apoptosis in neurons. The pan-neuronal marker Elav was used to identify neurons (n≥6; mean ± s.e.m.) in three independent experiments. c, control. (D) Apoptosis in glia. The pan-glial marker Repo was used to identify glia (n≥6; mean ± s.e.m.). Time points under the chart show absolute age in days and refer to the position on the mortality curve; results are grouped according to the chronological points. For instance: 45-day-old p35 mutant flies reached 80% of mortality in population and were analyzed simultaneously with 45-day-old wild-type controls that reached only 20% in mortality.

