Fig. 4.
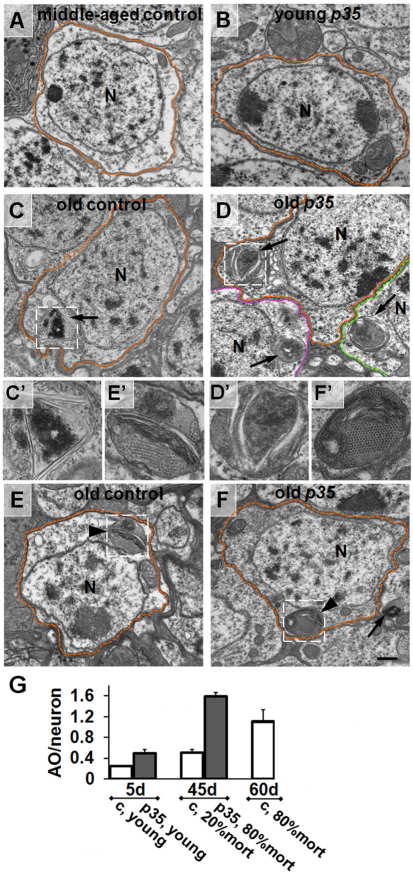
Accumulation of autophagosomal organelles in old p35 mutant brains. Electron micrographs of MB neurons from control wild-type and p35 mutant brains at different time points. (A,B) Representative images of a middle-aged wild-type neuron (A) and young p35 mutant neuron (B). Boundaries of individual cells are highlighted by colored dotted lines. N, nucleus. (C,D) Age-dependent accumulation of autophagosomes (arrow) in both controls (C) and p35 mutants (D). Note the clusters of adjacent cells containing multiple ATG organelles. C′–F′ are high-magnification images of organelles highlighted in C–F, respectively. (E,F) Characteristic appearance of age-dependent multi-molecular depositions (arrowhead) in controls (E) and p35 mutants (F). Depositions with hexagonal symmetry were often located in close proximity to multilamellar structures. Scale bar: 500 nm. (G) Increase in the average number of autophagic organelles (AO) per neuron in old p35 mutants. Because APGs containing multilamellar structures represent the vast majority of all autophagic organelles that we observed in this project, we combined data for APGs, MLBs and APGLs. A minimum of 20 neurons per brain were analyzed. Values are mean ± s.e.m. (n≥3 brains). c, control.

