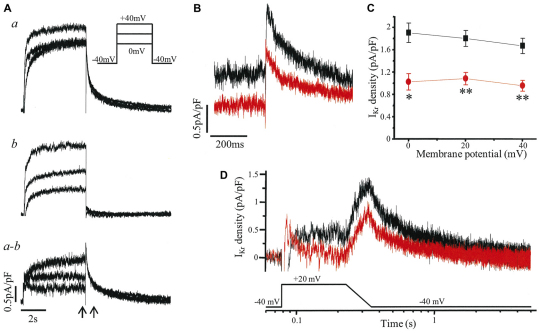
Fig. 5.
IKr recorded from iPSC cardiomyocytes with a ventricular-like AP. (A) Example of the isolation of IKr. Whole-cell current, here from a control iPS cardiomyocyte, was recorded in the absence (a) and then presence of 1 μmol/l E-4031 (b), with IKr defined as the subtracted current (a–b), i.e. the E-4031-sensitive current. Current was evoked by a 5-second depolarization from a holding potential of −40 mV as shown in the inset. (B) IKr of a control iPS (black) and LQT2 iPS (red) cardiomyocyte evoked as in A with the time segment between the arrows expanded to show the peak tail currents on return to −40 mV following a step to +20 mV. (C) The peak tail IKr densities of control iPSC (black; n=4) and LQT2 iPSC (red; n=5) cardiomyocytes at membrane potentials from 0 to +40 mV were significantly different (*P<0.01, **P<0.005). (D) IKr currents of control iPSC (black) and LQT2 iPSC (red) cardiomyocytes evoked by a voltage protocol of step to +20 mV for 150 ms and ramp of 120 ms back to the −40 mV holding potential.

