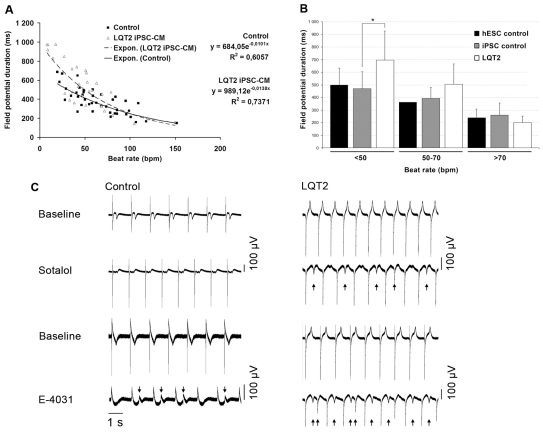
Fig. 6.
FPD measured on MEA. (A) The effect of the beating rate on FPD in control and LQT2 cardiomyocytes (CMs). Control and LQT2 cardiomyocytes had a negative correlation with moderately high coefficients of determination (R2). The exponential function gave the best fit as determined by R2 between different fitting functions. The LQT2 cardiomyocytes had significantly more prolonged FPD compared with controls, especially at low beating frequencies, as determined by nonlinear regression analysis (P=0.0136). (B) At beating rates below 50 beats per minute (bpm), the FPD of LQT2 cardiomyocytes differed significantly from control cardiomyocytes (*P<0.05) as determined by t-test. (C) Drug responses of control and LQT2 cardiomyocytes. Sotalol (19 μmol/l) and E-4031 (500 nmol/l for LQT2-specific cells and 700 nmol/l for control cells) was administered to the cardiomyocyte aggregates derived from control iPSCs and LQT2 iPSCs. For both cell lines, baseline and drug conditions for sotalol and E-4031 are shown. Arrows mark the site of pharmacologically induced EADs. With 500 nmol/l E-4031 there were no EADs observed in control cells.

