Fig. 4.
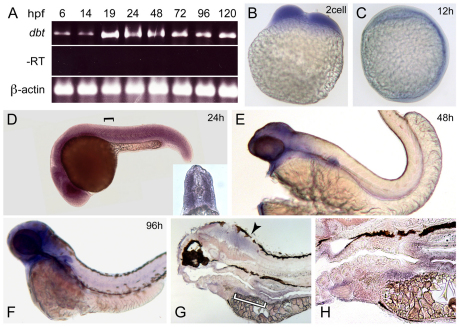
dbt becomes enriched in the brain and organs in the gut across development. (A) RT-PCR results are shown using mRNA isolated at different time points during zebrafish development. dbt was detected at all stages examined. –RT and β-actin controls are also shown. (B–H) In situ hybridization shows broad dbt expression at (B) the two-cell stage, (C) 12 hpf and (D) 24 hpf. The inset of a cross-section (the black bracket indicates the approximate level of the cross-section) reveals robust dbt expression in muscle. dbt expression become enriched in the brain and gut at (E) 48 hpf and (F) 96 hpf. (G) Sagittal sections of stained 96 hpf embryos illustrate expression in the brain (arrowhead) and gut. The white bracket indicates a portion of the region shown at higher magnification in H. Above the left edge of the white bracket, dbt expression in the liver can be observed, whereas above the right edge of the white bracket, dbt expression in the intestine is revealed.

