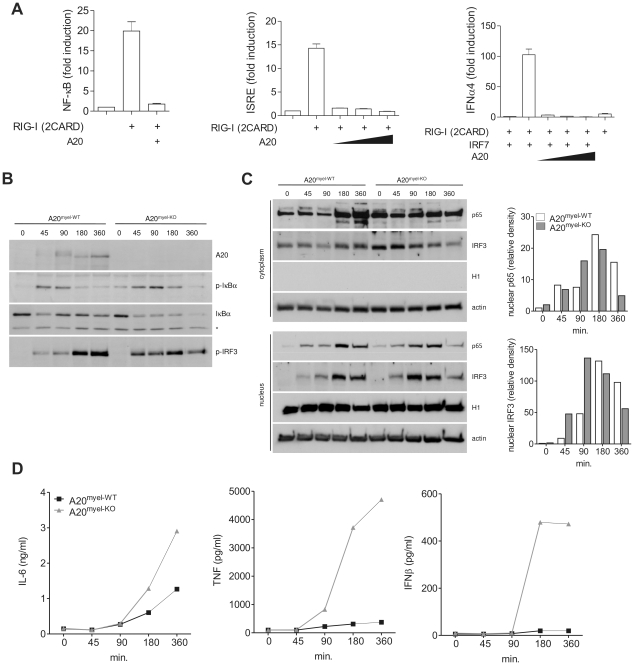
Figure 1. A20 inhibits NF-κB and IRF3 activation in response to RIG-I stimulation.
(A) HEK293T cells were transfected with NF-κB (left), IRF3 (middle) or IRF7 dependent luciferase reporter (right) plasmids, together with plasmids expressing RIG-I (2CARD), IRF7 (right) and increasing amounts of A20. Luciferase activity in cell extracts was analyzed in a luminometer. Numbers are averages +/− SD of 3 samples per set-up. (B–D) A20myel-KO and wild type (A20myel-WT) BMDM were transfected with LMW poly(I:C) and analyzed at different time points (minutes) after the start of transfection for IκBα phosphorylation and degradation, and IRF3 phosphorylation by immunoblotting of total cell extracts (B). The band that is non-specifically recognized by the anti-IκBα antibody (indicated by an asterisk) can be used as a loading control. Nuclear translocation of NF-κB (p65) and IRF3 was analyzed by immunoblotting of cytoplasmic or nuclear fractions (C). Quantification of band density for nuclear p65 and IRF3 is shown in bar graphs (expressed as relative density compared to the first lane; = time 0). IL-6, TNF and IFNβ levels in the supernatant of cells used in (B) were determined by bioassay (IL-6) and ELISA (TNF and IFNβ) as described in the ‘materials and methods’ section (D). Data are representative of 2 independent experiments.

