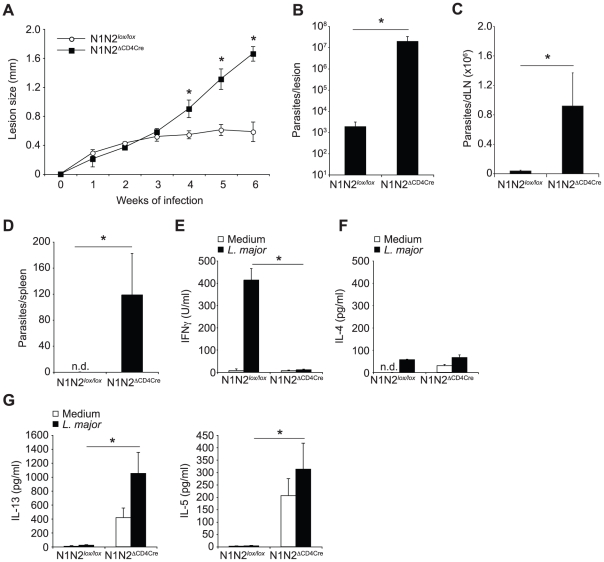
Figure 1. N1N2ΔCD4Cre mice on the C57BL/6 L. major resistant background are susceptible to infection.
(A) N1N2ΔCD4Cre and control N1N2lox/lox mice were infected with 3×10⁶ L. major promastigotes and lesion size measured weekly. Dots represent group mean of lesion size ± SEM. (B, C) Six weeks after infection, parasite load was assessed by LDA in footpads (B), dLN (C) and spleen (D). Histograms represent the mean number of parasite ± SEM (n≥3 mice per group). (E–G) IFNγ (E), IL-4 (F), IL-13 and IL-5 (G) secretion was quantified in supernatants of draining lymph node cells restimulated or not with UV-irradiated L. major 6 weeks after infection. Mean cytokine secretion ± SEM are given (n≥3 mice per group). Data are representative of at least 3 individual experiments. n.d. not-detectable. * p-value<0.05 versus control mice.

