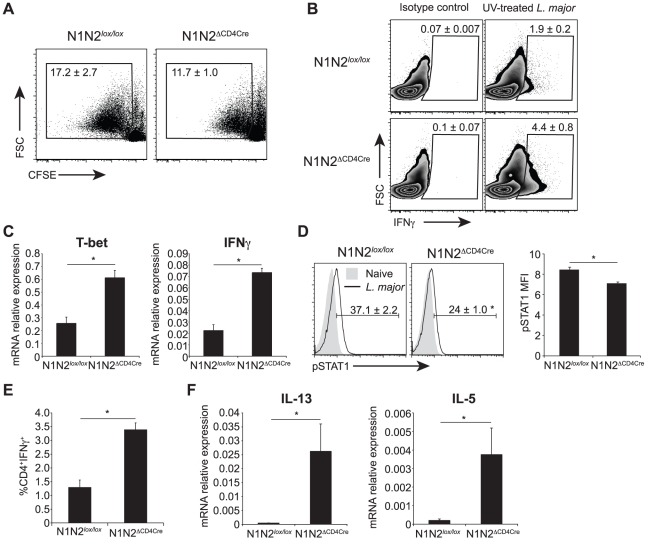
Figure 5. N1N2ΔCD4Cre mice transcribe T-bet and IFNγ in dLN CD4+ T cells but do not secrete it.
(A) Proliferation of CD4+ T cells was assessed by FACS. Draining LN cells of L. major-infected mice were isolated 6 weeks after infection, stained with CFSE and restimulated with UV-treated L. major for 72 h. Representative flow cytometry plots gated on CD4+ T cells are shown. Numbers in plots represent the mean percentage of proliferating cells ± SEM for 5 mice. (B) Intracellular levels of IFNγ were analysed by FACS in L. major-infected dLN cells restimulated for 72 h with UV-treated L. major. Representative flow cytometry plots are given. Numbers in plots represent the mean percentage of IFNγ+ cells within CD4+ T cells ± SEM for 5 mice. (C) Draining LN CD4+ T cells from N1N2ΔCD4Cre and N1N2lox/lox mice were sorted by FACS 21 days post L. major infection, T-bet and IFNγ mRNA levels were analyzed by quantitative RT-PCR. Data are represented as the mean ± SEM mRNA transcript levels normalized to HPRT mRNA levels (n≥3 mice per group). (D) Phosphorylation of STAT1 was assessed by FACS on dLN cells of N1N2ΔCD4Cre and N1N2lox/lox mice 3 weeks post infection. Naive mice were used as control. Representative flow cytometry plots gated on CD4+ T cells are shown. Numbers in quadrants indicate the mean frequency of pSTAT1+CD4+ T cells ± SEM. pSTAT1 mean fluorescence intensity MFI ± SEM is shown (n≥3 mice per group). (E) Draining LN cells of L. major-infected mice were restimulated ex vivo with PMA/ionomcyin for 4 h and level of intracellular IFNγ was assessed by FACS. The frequency of CD4+IFNγ+ T cells is given ± SEM for n≥3 mice per group. (F) mRNA expression of IL-13 and IL-5 was analyzed by quantitative real-time PCR in dLN cells isolated from N1N2ΔCD4Cre and N1N2lox/lox mice 6 weeks post L. major infection. Results are given as mean mRNA expression relative to HPRT ± SEM for n≥3 mice per group. Data are representative of 2–3 individual experiments. * p-value<0.05 versus control mice.

