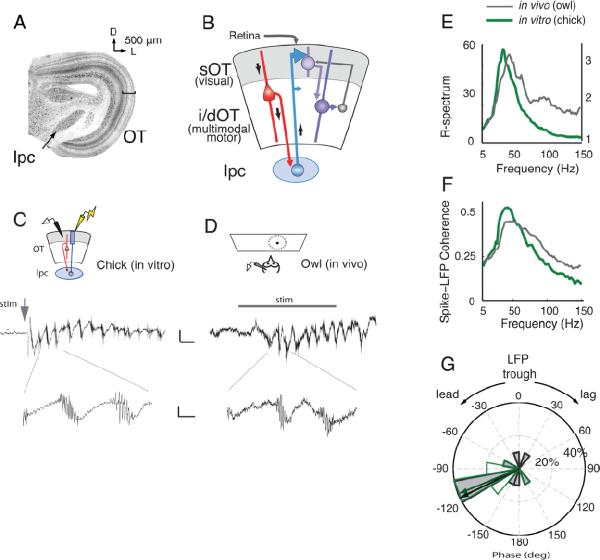
Figure 1. In vivo-like oscillations in an in vitro slice of the avian midbrain.
A) (Left) Low power image of a transverse, Nissl-stained section of the chicken midbrain. The nucleus isthmi pars parvocellularis (Ipc) is located medial to the optic tectum (OT). Bar indicates the sOT. D: Dorsal, L: Lateral.
B) Schematic of the chick midbrain circuitry. Retinal afferents enter from the most superficial aspect of the sOT, contacting both sOT and i/dOT neurons. A subclass of i/dOT neurons in layer 10 (red) project to the Ipc (blue), which in turn sends projections heavily to the sOT and to a lesser degree to the i/dOT. Feedback projections from the i/dOT to the sOT also exist (grey).
C) (Top) Schematic of the in vitro slice preparation of the chick midbrain. An extracellular recording electrode (black) and a stimulating electrode (yellow) were placed in the sOT. (Middle) In vitro oscillations in the superficial layers of a chicken midbrain slice in response to a single, 10 μA, 0.1 ms electrical stimulus (grey arrow) delivered to the retinal afferents. Scale bar: 50 ms, 20 μV. (Bottom) Expanded time scale showing a high frequency burst of spikes riding on top of the lower frequency (gamma-band) field potential. Scale bar: 10 ms, 10 μV.
D) (Top) Schematic of the in vivo preparation in the owl OT. An extracellular recording electrode was lowered into the sOT, and a small, moving dot was presented in the receptive field of the site. (Middle) In vivo oscillations in the sOT of the owl optic tectum in response to 350 ms visual stimulation (grey bar). Scale bar: 50 ms, 10 μV. (Bottom) Expanded time scale showing a high frequency burst of spikes riding on top of the lower frequency (gamma-band) field potential. Scale bar: 10 ms, 5 μV.
E) Average ratio spectra (R-spectra) of the oscillations recorded from chicken sOT in vitro (green, thick line, n=10 slices) and owl sOT in vivo (grey, thin line n=10 sites) showing a dominant peak in relative power in the low-gamma band (25–50 Hz). Y-axis on left for in vitro recordings; Y-axis on right for in vivo.
F) Spike field coherence (SFC) measured in the sOT from in vitro (green, thick line) and in vivo (grey, thin line) preparations (same recordings as in panel E). The SFC in both preparations shows a clear peak in the low-gamma band.
G) Phase relationship of the spikes relative to the trough of the LFP in the 25–50Hz frequency range from in vitro (green line, no fill) and in vivo (black line, grey fill) preparations (same recordings as in panel E, F). Spikes precede the LFP trough by ~120° of gamma phase. Radial axis: percent of sites. Arrows: median phase.

