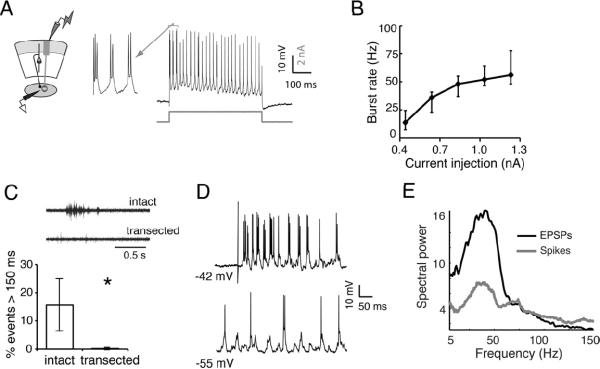
Figure 5. Ipc neurons resonate at gamma frequencies but require persistent input.
A) (Left) Schematic illustrating recording configuration in the Ipc. (Right) Intracellular recording from an Ipc neuron. A step depolarization (indicated by grey line below trace) induced a regular pattern of bursting.
B) Step depolarizations of various amplitudes increased burst rate between 14 and 56 Hz (n=5). Points on line represent median values, lower and upper whiskers represent 25th and 75th percentiles.
C) (Top) Example of a spontaneous, persistent oscillation recorded in the Ipc in intact slices, but not in transected slices. (Bottom) Spontaneous, persistent oscillations recorded in the Ipc are eliminated in transected slices. In intact slices (n=6), 15±9% of spontaneous oscillations persist for greater than 150 ms, while in transected slices (n=5), only 0.2±0.4% of spontaneous events with gamma power persisted longer than 150 ms (p<0.005, U-test). See Fig S4 for more details.
D) In an intact slice, intracellular recordings in the Ipc reveal periodicity. (Top bursting of an Ipc neuron following retinal afferent stimulation. (Bottom) Periodic EPSPs were revealed in the neuron upon hyperpolarization of the membrane potential.
E) Average power spectrum of postsynaptic potentials (black, n=5) indicates strong gamma periodicity in the synaptic input to Ipc neurons. Spectrum of the spiking responses (grey) shows that Ipc spike periodicity matched the frequency of the synaptic input.

