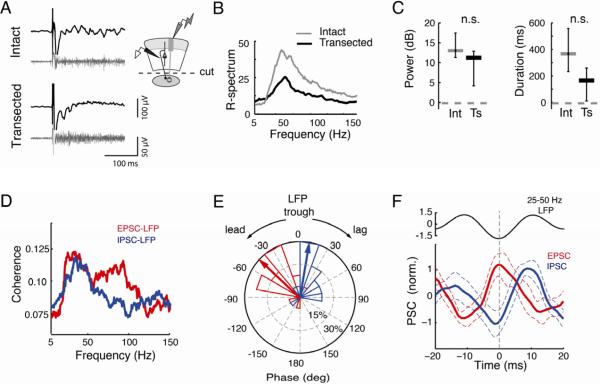
Figure 6. The i/dOT generates persistent gamma oscillations without Ipc connectivity.
Conventions as in Figure 3.
A) (Left) Evoked, persistent gamma oscillations recorded in the i/dOT are observed both in an intact slice (Top) and in a transected slice (Bottom). These recordings were made simultaneously with recordings in the sOT described in Figure 4. (Right) Schematic illustrating recording configuration in the i/dOT, and transection of connections with the Ipc.
B) Average R-spectra for responses in the i/dOT in intact (grey) and transected (black) slices (n=10 in each condition) show similar profiles.
C) (Left) Gamma power (25–50 Hz, in dB) of oscillations in i/dOT was not significantly different in intact (grey) and transected (black) slices. Intact=13.2 dB, transected=11.4 dB, p>0.2, U-test, n=10. (Right) Durations of gamma oscillations in the i/dOT were not significantly different in intact (grey) and transected (black) slices. Median durations for intact slices=373 ms, transected=172 ms, p>0.1.
D) Coherence between the extracellular LFP and the onset of simultaneously recorded EPSCs recorded at −65 mV (red), or IPSCs recorded at 0 mV (blue), indicates peak power in the lower gamma band (n=17 LFP-neuron pairs).
E) Phase of EPSCs (red) leads IPSCs (blue) relative to the trough of the 25–50Hz LFP oscillations. Negative angles represent onsets preceding (leading) the trough, and positive angles represent onsets following (lagging) the trough. Radial axis: percent of sites, outer circle represents 30% of sites. Wedges: histogram of the phase distribution. Arrows: Mean of the phase distribution. (n=17).
F) LFP-trough triggered averages of the EPSC (red) and IPSC (blue). For comparison with IPSC peak times, EPSCs have been inverted relative to standard convention, such that the peak of the EPSC represents the maximal inward current. Dashed vertical line: t=0 at LFP trough. Dashed lines: 95% confidence intervals of the mean waveform across n=17 sites. Top inset: mean 25–50Hz LFP oscillation cycle. All data averaged over 7000 LFP cycles.

