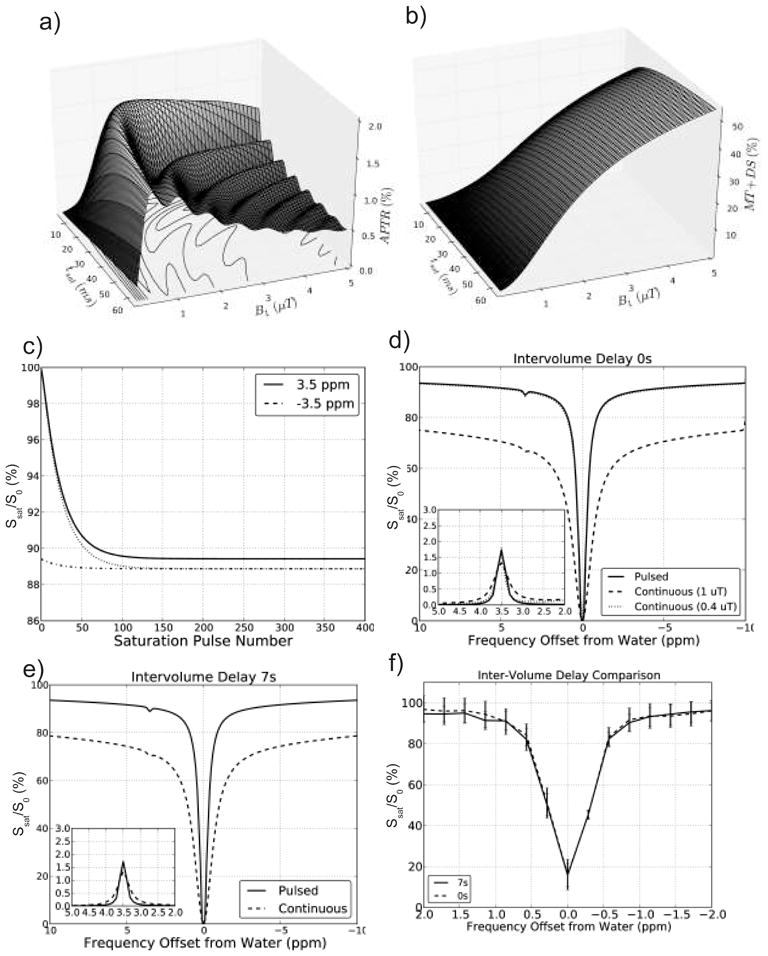
Figure 3.

Simulations of the effect of saturation strength and duration on the pulsed steady state APT effect for a 3-compartment model of semi-solid macromolecular protons, solute amide protons, and bulk water protons (Table 1). a) APTR for TR = 65 ms, showing a maximum at tsat = 25 ms and B1 ~ 1 μT. b) MTC+DS effect at 3.5 ppm for TR = 65 ms using zero APTR. A strong reduction with decreasing B1 can be seen, leading to very small MTC for tsat = 25 ms at B1 values of 1 μT or less. c) Normalized water signal intensity (S/S0) as a function of number of TR intervals to determine the number of saturation pulses needed to reach steady state. Simulations for saturation at 3.5 ppm (APT frequency) and −3.5 ppm (control frequency) for an initially fully relaxed signal (solid and dashed lines, resp.) and for a previously obtained steady state at a frequency differing by 0.1 ppm (dotted and dash-dotted lines, resp). d) Comparison of Z-spectra for pulsed steady-state CEST (solid curve), continuous saturation CEST (dashed line) with a 0 s inter-volume delay and continuous saturation with B1 (0.4 μT) designed to match pulsed saturation (dotted line). The inset shows the MTRasym for both simulations. e) as d) but with a 7 s inter-volume delay. f) Mean signal intensity (and standard deviation) of an in vivo region in white matter (major forceps) acquired from one acquisition with 0 s inter-volume delay (dashed line) and one acquisition with 7 s inter-volume delay (solid line). This pair of acquisitions was used to corroborate the simulations that showed little effect of the minimal inter-volume delay.
