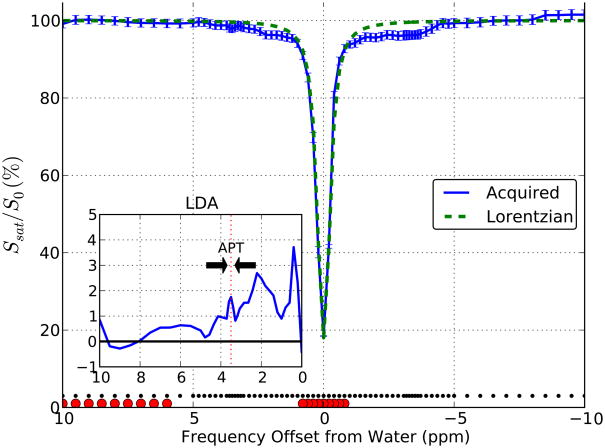
Figure 5.
In vivo Z-spectra for a region in white matter (major forceps). Z-spectrum acquired at frequencies denoted by the small black dots along the bottom. The lack of detectable saturation at frequencies > 8 ppm and < −8 ppm confirm the expected negligible MTC for the steady state acquisition. The acquired data for the frequencies indicated by the large red circles were fitted to a Lorentzian function. The difference between the Lorentzian (green dashed line, assumed to be based only on direct water saturation) and acquired data indicate that exchange effects occur both at positive and negative frequencies with respect to water. Inset: the mean signal between the Lorentzian fit and data acquired between 3.3 and 3.7 ppm was used to calculate the APTR.

