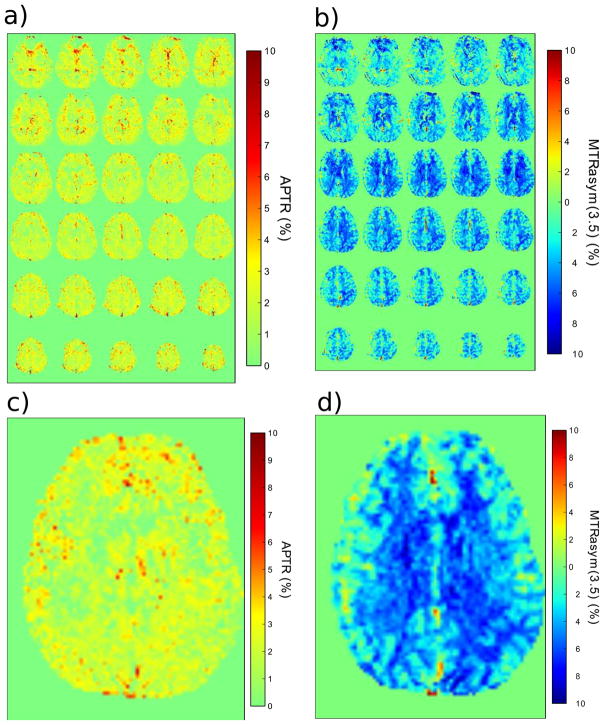
Figure 6.
a) An amide proton transfer ratio (APTR) map quantified from the mean signal between 3.3 and 3.7 ppm in the difference plot (Figure 5 inset) on a per voxel basis. b) MTRasym(3.5ppm) map based on asymmetry analysis of the same data as in a). c) Slice 20 of the APTR map in a). d) Slice 20 of the MTRasym(3.5ppm) map in b). Note the negative signal intensity in the MTR asymmetry method.

