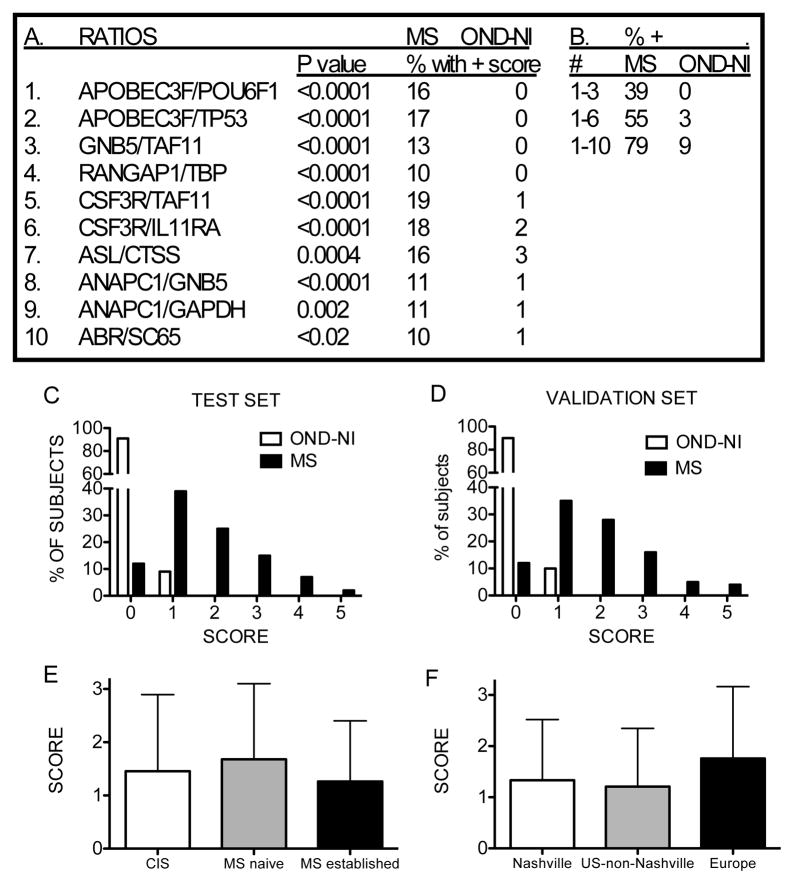
Figure 7.
Discrimination between MS and OND-NI subjects using 10 gene expression ratios. (a) Identification of genes making up the 10 unique discriminatory ratios. P values compare individual ratio values between MS and OND-NI subjects. (b) Increasing the number of gene expression ratio increases the ability to discriminate between MS and OND-NI subjects. (c) Score distribution using 10 ratios in the training set. (d) Validation of results by analyzing 40 new MS subjects and 40 new OND-NI subjects. (e) Mean scores ± std. dev. among subjects with CIS, initial diagnosis of MS and established MS. P values were not significant among any of the comparisons. (f) Mean scores ± std. dev. among subjects based upon geographic sites. P values were not significant for any of the comparisons.

