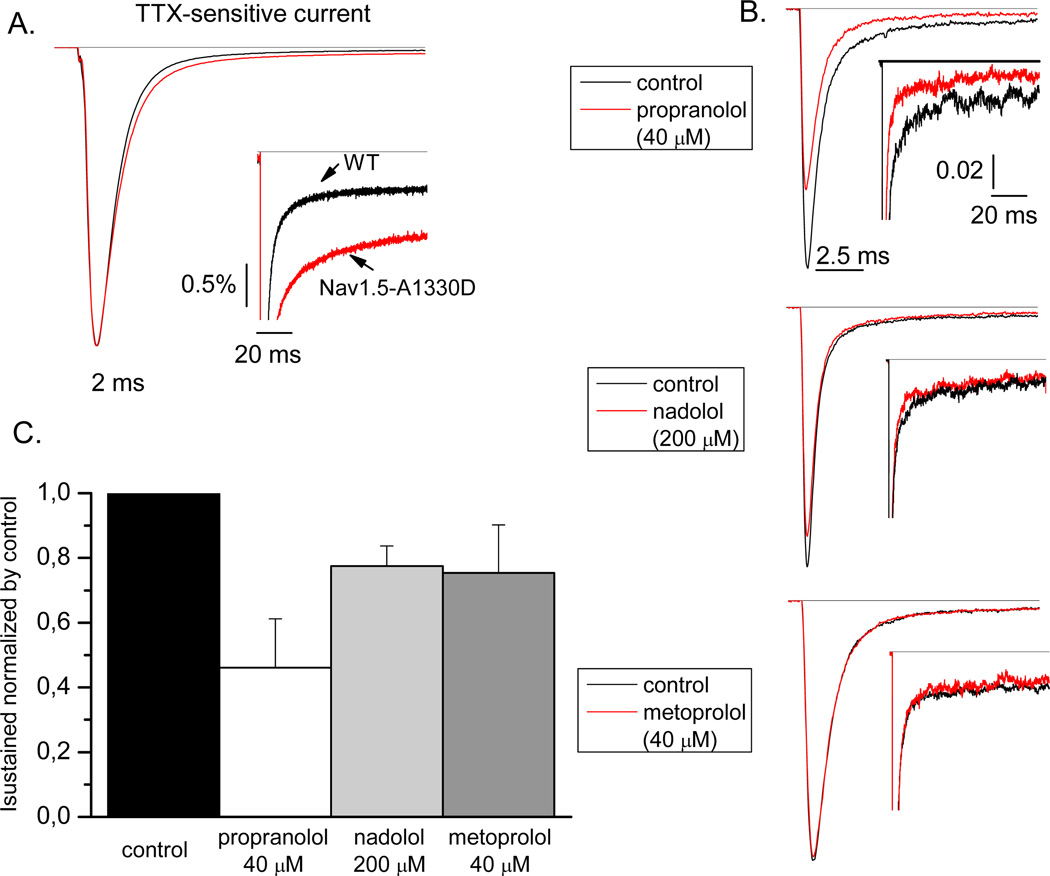
FIGURE 4.
Typical TTX-sensitive current for WT or A1330D channels is shown in panel A. In the inset, the late current is shown. In panel B, typical recordings of INa in control and in the presence of drugs at steady state are shown. In the inset, an amplified view of the late current is shown. The current in panel A and B are normalized to the peak current recorded under control condition. In panel C, the average data showing the TTX-sensitive current in the presence of the three drugs normalized by the TTX-sensitive current in control condition (considered as 1). The TTX-sensitive current was measured as difference between current at steady state in control or in the presence of a β-blocker and current at steady state after TTX perfusion. Sustained current was measured as average current at the last 5 ms of the 100 ms step (−10 mV) and expressed as percentage of the peak TTX-sensitive current.

