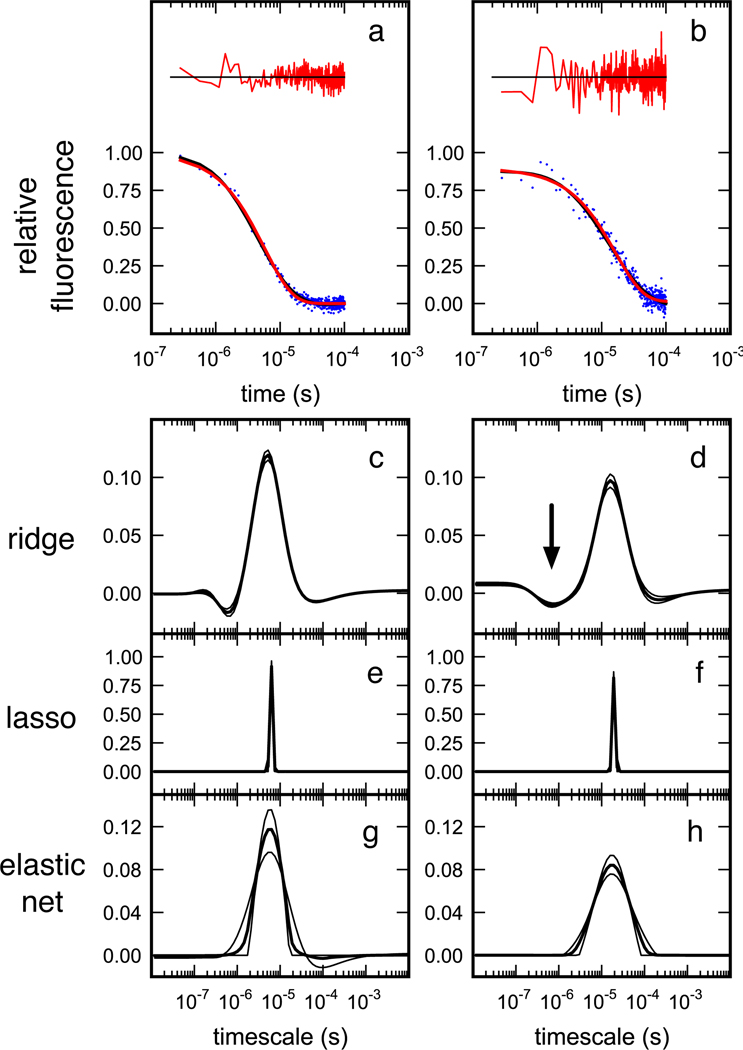
Figure 5.
Relative fluorescence time traces reprinted from Liu et al. (2008): Relaxation kinetics of a WW domain (variant 20) after T-jump to (a) the melting temperature, and (b) 19° C below the melting temperature. Single-exponential fits to the time traces and their residuals are shown in red; ridge regression fits are shown in black. Rate spectra for these two traces are shown for (c,d) ridge regression, (e,f) lasso regression, and (g,h) elastic net regression. Ridge regression identifies a broadened (negative amplitude) peak near the 1 µs timescale (marked with arrow).

